Navigation-Page Spectrometers & Spectroscopy Systems Helena Bodem 5. September 2026
TOPAG_Sum Frequency Generation Spectrometer_Ekspla

SFG Spectroscopy Systems

Most SFG spectroscopy systems use broadband femtosecond pulses to acquire spectra quickly without scanning. However, these systems reach their limits once two resonances lie only a few wavenumbers apart. Ekspla developed the Scanning ps SFG spectrometer specifically for this use case. It measures with narrowband picosecond pulses and achieves a spectral resolution of up to < 3 cm⁻¹, with a seamlessly tunable range from 2.3 to 16 µm across the entire fingerprint region. Despite the point-by-point measurement, fast wavelength sweeping enables measurement speeds comparable to broadband systems.

Where femtosecond pulses are required, for example with sensitive aqueous or biological samples, we also offer a broadband fs SFG spectrometer with a resolution of up to < 9 cm⁻¹. Both are complete systems, including the laser source and analysis system, and can be individually expanded, for example for double-resonance or phase-sensitive measurements.

Monoolein surface spectra

Scanning ps SFG Spectrometer | Ekspla

Narrowband excitation for high spectral resolution

  • Spectral range: 625 – 4300 cm⁻¹
  • Spectral resolution: down to < 3 cm⁻¹
  • Measurement: Fast Scan with PMT detection

Broadband fs SFG Spectrometer | Ekspla

Broadband excitation for fast spectral acquisition

  • Spectral range: 1000 – 4300 cm⁻¹
  • Spectral resolution: down to < 3 cm⁻¹
  • Measurement mode: Broadband accumulation with CCD detection
  • Optimized for fast and time-resolved measurements
TOPAG_ns-TA_spectrometer_enVISTA_transparent

Nanosecond TA Systems

Magnitude Instruments’ TA spectrometers are compact all-in-one systems for time-resolved transient absorption spectroscopy, combining exceptional sensitivity with fast data acquisition. Patented noise suppression enables precise measurement of even the weakest signals, while low pump energies minimize sample perturbation and reduce nonlinear and thermal artifacts.

All components, from the light source to the detector, are integrated into a compact benchtop instrument that fits easily on a laboratory bench. Developed by scientists for scientists, these systems combine maximum sensitivity, rapid data acquisition, and intuitive operation in a single instrument.

ARIS-all-Models

UV-VIS-NIR Spectrometers

The ARIS spectrometer combines high sensitivity, low stray light, and a compact footprint in a laboratory-grade instrument for research, industry, portable measurement systems, and OEM applications.

With six configurable spectral ranges and integrated signal processing, ARIS offers a flexible solution for UV-VIS and NIR spectroscopy. Its compact design supports straightforward integration into existing measurement setups and customized systems.

ARIS UV

For short-wavelength UV applications requiring high spectral resolution

  • Wavelength range: 185–420 nm
  • Spectral resolution: 0.33 nm typ. / 0.40 nm max. FWHM
  • Standard slit: 20 µm

ARIS UV/VIS

Covers the UV and visible spectral regions for versatile spectral analysis

  • Wavelength range: 185–550 nm
  • Spectral resolution: 0.40 nm typ. / 0.60 nm max. FWHM
  • Standard slit: 20 µm

ARIS VIS

Measurements in the visible spectral range for optical and industrial applications

  • Wavelength range: 350–840 nm
  • Spectral resolution: 0.60 nm typ. / 0.70 nm max. FWHM
  • Standard slit: 20 µm

ARIS VIS/NIR

Covers the visible and near-infrared spectral regions for flexible spectral analysis

  • Wavelength range: 510–1020 nm
  • Spectral resolution: 0.80 nm typ. / 1.00 nm max. FWHM
  • Standard slit: 20 µm

ARIS Wide

Broadband UV-VIS spectrometer for a wide measurement range

  • Wavelength range: 185–1000 nm
  • Spectral resolution: 1.00 nm typ. / 1.20 nm max. FWHM
  • Standard slit: 20 µm

ARIS Wide NIR

Broadband spectrometer for VIS and NIR spectral analysis

  • Wavelength range: 300–1100 nm
  • Spectral resolution: 1.10 nm typ. / 1.40 nm max. FWHM
  • Standard slit: 20 µm
User-Replaceable Entrance Slits

Adjust spectral resolution and optical throughput

User-Replaceable-Entrance-Slits
  • Slit widths: 10, 20, 50, 75, 100, 150, 200, and 300 µm
  • User-replaceable
  • Function: Adjustment of spectral resolution and optical throughput
  • Suitable for: Different spectroscopy applications and measurement conditions
Direct-Attach Collimator

Combines the collimator and entrance slit in a single unit

Direct-Attach-Collimator
  • Integrated entrance slit: 20 / 50 / 100 µm
  • Direct mounting: On the spectrometer
  • Function: Light collection and collimation
  • Suitable for: Compact and fiber-coupled measurement setups
Cosine Corrector

Flexible collimation of divergent fiber output

Cosine-Corrector
  • Connection: SMA
  • Function: Collimation and fiber coupling
  • Adjustable: Field of view and light collection
  • Suitable for: Fiber-coupled spectroscopy
Fiber-optical Patch Cables

Defined light collection for irradiance measurements

Fiber-Patch-Cable
  • Acceptance angle: 180°
  • Angular response: Near-cosine angular dependence
  • Function: Defined light collection
  • Suitable for: Irradiance, light-source, and spectral measurements
SMA Collimator

Connect light sources, sampling optics, and ARIS spectrometers

SMA-Collimator
  • Connectors: SMA905
  • Versions: Various optical fibers
  • Protection: Rubber protective caps
  • Option: Custom fiber configurations on request
Wavemeter-WS600

Laser Wavemeter

The WS600 High-Resolution Wide-Range Wavelength Meter is a high-resolution laser wavemeter for fast and precise determination of the absolute laser wavelength.

With a spectral range from 190 to 1100 nm and an absolute accuracy of ±3 pm, the WS600 is suited to the characterization, alignment, and monitoring of a broad range of laser sources. In addition to wavelength measurement, it can determine the spectrum and the FWHM of the measured spectral line. The system works with both CW and pulsed lasers and enables real-time wavelength monitoring during laser tuning.

Wavemeter WS600

Precise wavelength measurement for laser and spectral analysis

  • Measurement range: 190–1100 nm
  • Wavelength accuracy: ±3 pm
  • Spectral resolution limit: 6 pm at 193 nm to 40 pm at 1200 nm
  • Source linewidth: ≤ 125 cm⁻¹
  • Laser types: CW and pulsed
  • Sensitivity: < 0.5 µW at 632.8 nm
  • Input coupling: Fiber-coupled or free-space
  • Trigger: TTL, 3–15 V
Software-Wavemeter-WS600

The intuitive WLMeter software helps users acquire and monitor laser wavelengths, spectra, and linewidths over time.

  • Wavelength: Absolute wavelength measurement
  • Spectrum: High-resolution spectral display
  • FWHM: Determination of spectral linewidth
  • Real-time monitoring: During laser tuning
  • Lines Array: Wavelength trend over time
  • Calibration: Reference wavelength, e.g. He-Ne at 632.816 nm
  • Data: Saving and exporting measurement data
MISS-2D-spectrum

Spatially Resolved Spectral Measurements

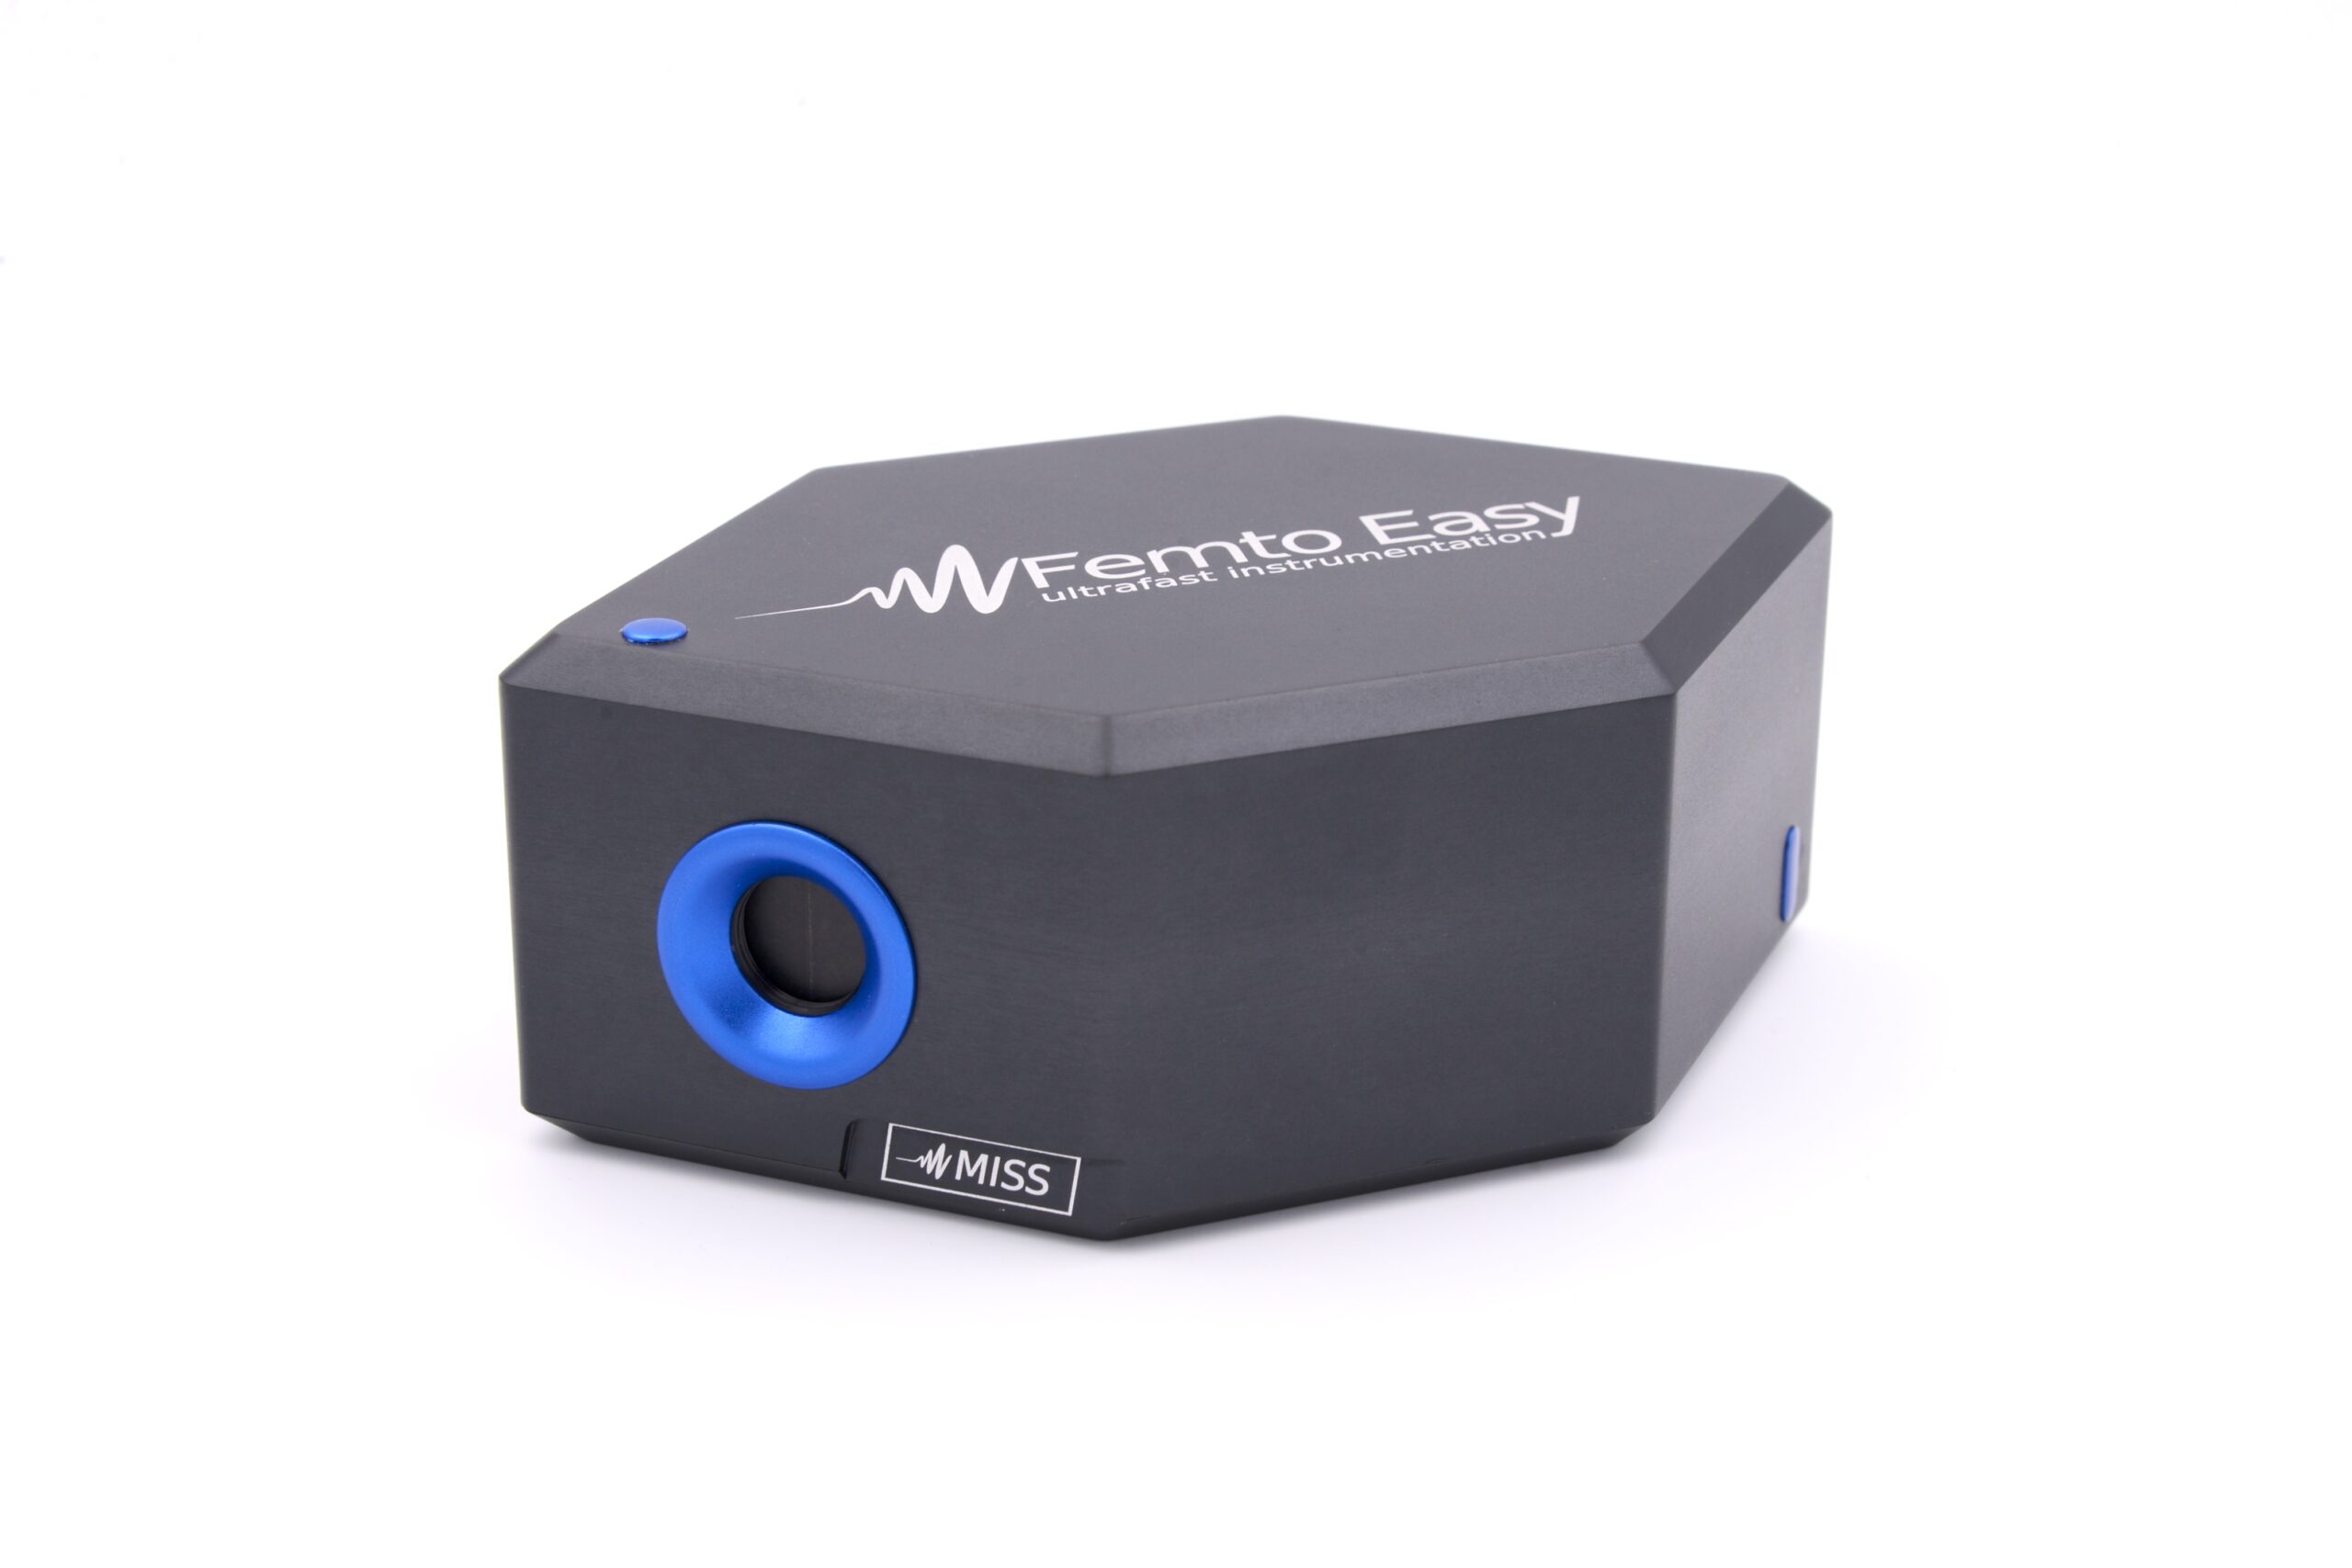
The MISS spectrometer (Mini Imaging Spatial Spectrometer) from Femto Easy enables spatially resolved spectral analysis of laser beams. Unlike conventional spectrometers, it reveals spectral variations across the beam profile and enables precise characterization of spatio-spectral couplings and spatial chirp.

MISS measures both horizontal and vertical spatial chirp and is ideally suited to the characterization and optimization of ultrashort-pulse lasers and broadband laser systems. Its compact design allows the 2D spectrometer to be flexibly integrated into existing optical setups and at different stages of amplified laser systems.

MISS_Mini Imaging Spatial Spectrometer_Ultra Short Pulse Diagnostics_Metrology_Topag

2D Spectrometer MISS UV-VIS

Acquire spatially resolved spectra of ultrashort pulses

  • Wavelength range: 240–1100 nm
  • Spectral resolution: < 0.35 nm
  • Spatial resolution: < 3.6 µm
  • Repetition rate: Single-shot up to 75 kHz

2D Spectrometer MISS SWIR

Acquire spatially resolved spectra of ultrashort pulses

  • Wavelength range: 400–1700 nm
  • Spectral resolution: Up to 1 nm
  • Spatial resolution: Up to 6.3 µm
  • Repetition rate: Single-shot up to 200 kHz
Echelle_spectrum_data-LB_plot

Echelle Spectrometers

The RS10K and RS40K echelle spectrometers enable the simultaneous acquisition of broad spectral ranges at high spectral resolution. They are ideally suited to laser characterization, high-resolution spectroscopy, and precise optical spectral analysis.

The echelle principle combines an echelle grating with a cross-dispersing element. The spectrum is imaged in two dimensions onto an area detector, enabling acquisition in a single exposure without mechanical scanning. With a resolving power of R = 8,000–17,000 for the RS10K and R = 32,000–44,000 for the RS40K, both systems combine high spectral detail with broad simultaneous spectral coverage.

Key benefit: Capture the entire spectrum and analyze the finest spectral structures, quickly, comprehensively, and without mechanical scanning.

RS10K_and_RS40K

RS10K Echelle Spectrometer

High-resolution echelle spectrometer for broad spectral ranges

  • Spectral range: 450–1030 nm
  • Resolving power [R = λ/Δλ]: 17,000–8,000
  • Spectral resolution [Δλ]: 60 pm at 632.8 nm (FWHM)
  • Wavelength accuracy: < 50 pm
  • Signal-to-noise ratio: 300:1
  • Acquisition rate: Up to 10 Hz

RS40K Echelle Spectrometer

High-resolution echelle spectrometer for demanding spectral analysis

  • Spectral range: 430–950 nm
  • Resolving power [R = λ/Δλ]: 44,000–32,000 (430–950 nm)
  • Spectral resolution [Δλ]: 16 pm (FWHM) at 632.8 nm
  • Wavelength repeatability: < 20 pm
  • Signal-to-noise ratio: 300:1
  • Acquisition rate: Up to 10 Hz
RedSolve-Software

The powerful RedSolve software enables spectra from the RS10K and RS40K to be acquired, visualized, and analyzed clearly. It provides live spectral display, targeted analysis of individual spectral regions, and recording and further processing of measurement data.

  • Live spectrum display
  • Spectral analysis and ROI selection
  • CSV data export
  • Integrated data visualization
  • Python API for automated measurement workflows
  • Virtual mode for testing the software without a connected spectrometer
Scroll to Top